
What Are the Best Solar Energy Products for 2026?
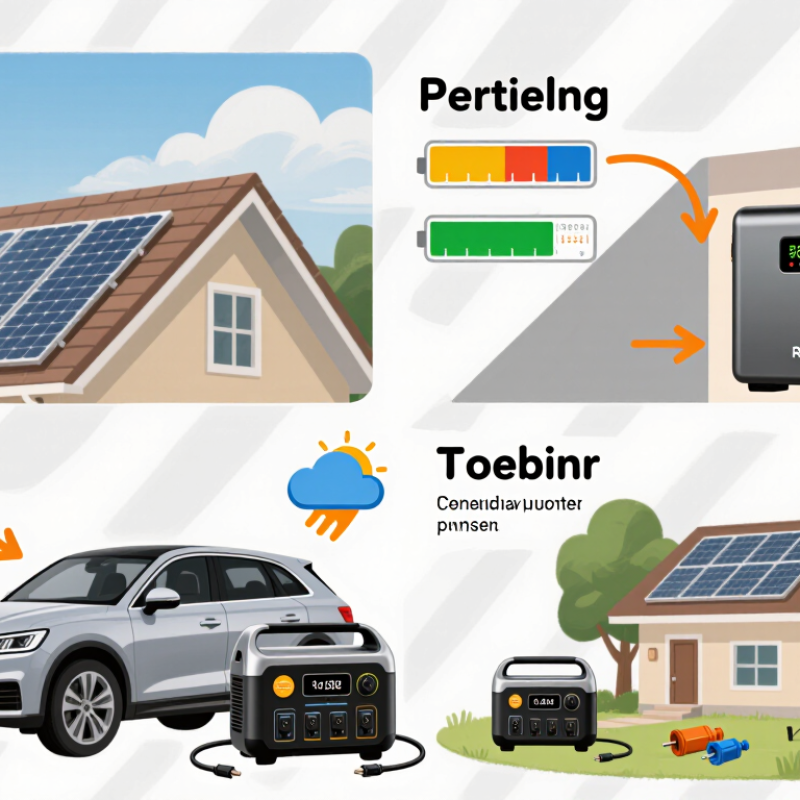
In 2026, choosing Solar Energy Products means matching equipment to real household needs, not chasing the newest feature. Rooftop panels, home batteries, and portable power stations solve different problems. A household facing evening energy use may value storage, while a renter might prefer a compact, movable system. Details matter. Compare usable battery capacity, panel efficiency, inverter output, warranty terms, and component compatibility. Marketing labels alone cannot show how a system performs on a cloudy afternoon.
This guide examines the main product categories and the practical trade-offs buyers should consider. Panel output depends on placement, shade, and local weather, so published ratings are only part of the picture. Battery capacity matters, but so do charging speed and the appliances a system can actually support. For portable products, check the included cables, weight, and charging options before imagining them beside a tent or in a car trunk. Small print matters. Installation requirements and warranty coverage can also affect the real cost over time.
There is no single best choice for every home, and product specifications do not guarantee identical results in daily use. Compare manufacturer data with independent testing where available, and ask qualified installers about system compatibility. Even a careful comparison has gaps: household energy habits change, and forecasts are not promises. The aim here is a clearer shortlist, grounded in measurable features rather than glossy claims.
How to Compare Solar Products as IEA Forecasts PV at 80% of Renewable Growth
In 2026, compare solar products by how they work together, not by one impressive specification. The IEA’s Renewables 2024 report forecasts solar PV will provide nearly 80% of global renewable power capacity additions through 2030. That rapid expansion makes practical choices important: compare module output under similar conditions, then check inverter capacity, shade response, and system compatibility. The details matter.
For durability, examine product warranties and stated annual degradation, but treat estimates as estimates. A 2013 review by NREL researchers found median PV module degradation of about 0.5% per year across the studies reviewed. Local heat, dust, and installation quality can change real-world results. A comparison can still feel incomplete when quotes use different assumptions; request the same roof layout and energy-use profile before deciding.
Tips: Ask for an itemized quote and an annual production estimate. Check whether the inverter supports your planned system size and future expansion. If considering a battery, compare usable capacity and expected backup loads—not just the headline capacity. Small differences add up.
How to Assess Solar Panels: NREL Tracks Silicon Cell Records Above 27%
A silicon cell record above 27% is an impressive research milestone, but it does not mean a rooftop panel converts more than 27% of sunlight. NREL tracks verified cell-efficiency records under controlled test conditions. Those results help show what laboratory designs can achieve. They are not direct predictions of a household system’s annual output.
When assessing solar products for 2026, separate cell records from module ratings. A finished module includes protective glass, wiring, and gaps between cells, all of which affect its rated efficiency. Check whether performance figures come from independent testing, and compare panels under the same rating conditions. Small differences on a specification sheet may matter less than shading, roof direction, temperature, and installation quality.
Look closely at the details. A shaded chimney can reduce output, even when the cells are highly efficient. That matters. Warranty terms, degradation rates, and measured power ratings offer practical context alongside record charts. I still find it tempting to treat the highest number as the best choice. That is an easy mistake. A lab record shows technical potential; it cannot, by itself, tell you how much useful electricity a particular roof will produce.
What Are the Best Solar Energy Products for 2026? — How to Assess Solar Panels: NREL Tracks Silicon Cell Records Above 27%
| Solar product category | Typical module efficiency | Best suited for | Key strengths | What to assess before buying |
|---|---|---|---|---|
| Monocrystalline silicon modules | About 19–23% for many current products; check the individual module datasheet. | Most homes and businesses, especially where roof area is limited. | Widely available, well-established manufacturing, and strong output per unit of roof area. | Compare rated power, module efficiency, product and performance warranties, temperature coefficient, and certification details. |
| High-efficiency silicon modules | Often in the low-to-mid 20% range; the actual figure varies by design and product. | Installations seeking higher output from a constrained roof area. | Can provide more rated capacity from a similar panel area than lower-efficiency options. | Compare complete-system cost and expected energy yield, not efficiency alone. Confirm dimensions, mounting compatibility, and warranty terms. |
| Bifacial modules | Front-side module efficiency is generally reported on the same basis as comparable module technologies. | Ground-mounted or elevated installations with reflective surfaces and suitable rear-side exposure. | Can generate additional electricity from light reaching the rear of the module. | Rear-side gain depends on mounting height, ground reflectivity, shading, and system layout; request a site-specific energy estimate. |
| Thin-film modules | Efficiency varies substantially by material and product; many commercial modules have lower efficiency than leading silicon modules. | Projects where weight, flexibility, appearance, or a large installation area is important. | Some designs can be lightweight or adaptable to particular building surfaces and applications. | Check the specific module's efficiency, installation requirements, degradation data, warranty, and total area needed for the target capacity. |
| Building-integrated photovoltaics (BIPV) | Product-specific; compare the rated electrical output with conventional modules on a consistent basis. | New construction or renovations where photovoltaic materials also serve as part of the building envelope. | Can combine electricity generation with functions such as roofing, façade, or shading elements. | Assess electrical performance alongside weatherproofing, building-code compliance, replacement access, installation details, and total project cost. |
| Perovskite and tandem research cells | Research-cell results can exceed the efficiency of conventional silicon research cells; commercial module performance is a separate measure. | Technology monitoring and future product evaluation rather than assuming a laboratory result is a purchasable module rating. | Tandem designs can use layers that absorb different parts of the solar spectrum. | Check whether a result is a certified research-cell measurement or a commercially available module specification. Also assess durability, manufacturing scale, and independently verified warranties. |
How to interpret the 27%+ reference: NREL's research-cell efficiency tracking concerns laboratory cell records. A record cell is not the same as a finished commercial module: module efficiency, field performance, durability, price, and system design should be assessed separately. Efficiency ranges above are broad category guidance, not a guarantee for any specific product.
How to Select Inverters and Optimizers for Efficient Solar Conversion
For 2026, inverter choice should start with the roof, not a product ranking. NREL’s PVWatts model uses 96% as the default nominal inverter efficiency, a useful benchmark rather than a guarantee of real-world output. Compare efficiency under partial loads, temperature limits, warranty terms, and monitoring detail. A hot attic can reduce performance. So can poor system design.
String inverters suit arrays with similar sun exposure and simple roof layouts. Module-level power optimizers can help when panels face different directions or encounter recurring shade, but they add components and potential service points. No device fixes shade magically.
IEA PVPS’s Trends 2024 report estimated about 447 GW of new solar capacity was installed worldwide in 2023, underscoring how quickly system designs are scaling. For an actual home, ask an installer to model hourly shade and compare annual energy yield, not just peak efficiency.
Request the assumptions in writing. I would also check whether monitoring can identify a weak panel without a costly site visit; that detail is easy to overlook.
Why Add Battery Storage: IRENA Reports Utility-Scale Costs Fell 89% Since 2010
For 2026, a strong solar setup pairs efficient panels with a compatible hybrid inverter and battery storage. The battery-cost story is striking. IRENA’s Renewable Power Generation Costs in 2023 reports that utility-scale battery storage costs fell about 89% from 2010 to 2023. That does not mean every home system is affordable. Installation, usable capacity, local tariffs, and backup needs still shape the value. A battery can store midday solar power for evening lights, cooking, or a refrigerator. Small details matter.
The International Energy Agency’s Batteries and Secure Energy Transitions report says global battery storage additions reached about 42 gigawatts in 2023, rising more than 130% from 2022. That rapid growth supports the case for storage, but it is not proof that every household needs one. Compare usable battery capacity, round-trip efficiency, warranty terms, and whether the system can power essential circuits during an outage. It is easy to oversell the payback. A shaded roof or low evening electricity use can change the calculation.
Tips: Ask for an estimate using your hourly electricity use, not just your monthly bill. Check what the battery can actually run. A few lights and a refrigerator may be realistic; an entire home may not be.
Which Solar System Fits Your Needs? SEIA Says Solar Was 64% of U.S. New Capacity in 2023
In 2023, solar made up 64% of new U.S. electricity-generating capacity, according to the Solar Energy Industries Association. That figure shows how quickly the technology is growing. It does not mean every home is a good fit. Start with your electricity bills, daytime usage, roof direction, tree shade, and plans for the property.
A grid-connected rooftop system may suit households focused on lowering daytime electricity use. Panels produce power, while an inverter converts it for household use. If outages are a concern, a battery can store some solar electricity for later. It adds cost, though. Think about which appliances truly need backup, such as a refrigerator, rather than assuming a battery can run the whole house.
Ask installers to show estimated production by month, expected equipment lifespan, warranty terms, and how shading affects output. Compare the assumptions, not just the total price. A tidy estimate can still overlook a growing tree or higher future electricity use. Solar is not a perfect fit for every roof; sometimes waiting, improving efficiency, or choosing a smaller system deserves a closer look.
Related Posts
-
Unconventional Applications of Solar Energy: Innovations Shaping the Future of Sustainability
-

What is the Best Energy Solar Panels for Global Buyers?
-

Comprehensive Insights into Energy Solutions Solar for Global Buyers
-
Exploring Alternative Options for the Best Power Solar Panels in Global Markets
-
Unlocking the True Potential of Solar Energy: Innovations Shaping a Sustainable Future
-

2026 Top Solar Solutions for Sustainable Energy Innovation?